· 7 min read
Cutting LLM inference cost and latency without making the feature worse
Five levers, in the order I pull them. Prompt caching with a stable prefix, the right model per request, streaming for time to first token, batching offline work, and a cost line logged for every request so you know which lever matters.

The first bill for an LLM feature is usually a surprise in one of two directions. Either it is tiny and nobody thinks about it again until usage grows, or it is larger than expected and someone asks for the cheapest model by Friday. Both reactions skip the useful step, which is finding out where the tokens and the seconds actually go.
These are the levers I reach for, in roughly the order I pull them. The first ones are close to free. The later ones trade something away, so I only pull them with an eval running next to me. The code uses the Anthropic TypeScript SDK; the ideas apply to any provider with caching and batch pricing.
Start by logging cost per request
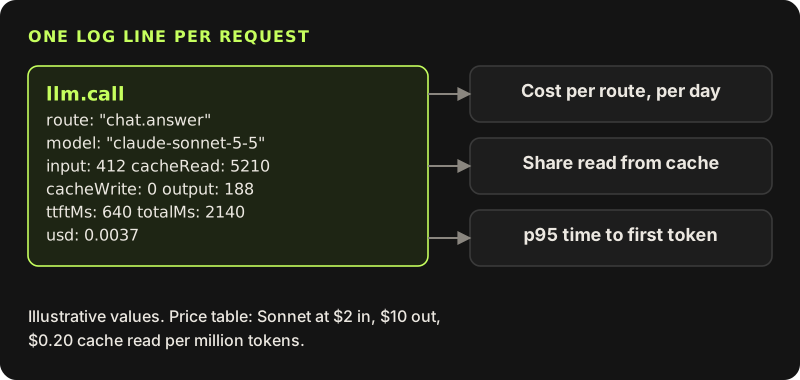
I put this first even though it saves nothing by itself, because every decision after it depends on it. Each model call goes through one wrapper that records the route (which product feature made the call), the model, token counts split the way the bill splits them, time to first token, total time and the computed cost.
import Anthropic from "@anthropic-ai/sdk";

// USD per million tokens, current when I wrote this (October 2026). Keep them in config and
// check them against the pricing page. Cache reads bill at about a tenth of the input rate.
const PRICE: Record<string, { in: number; out: number; cacheRead: number }> = {
  "claude-opus-5-5": { in: 4, out: 20, cacheRead: 0.2 },
  "claude-sonnet-5-5": { in: 2, out: 10, cacheRead: 0.2 },
  "claude-haiku-5-5": { in: 0.1, out: 0.5, cacheRead: 0.01 },
};

export function costUsd(model: string, u: Anthropic.Usage, opts: { batch?: boolean } = {}) {
  const p = PRICE[model];
  const usd =
    (u.input_tokens * p.in +
      (u.cache_creation_input_tokens ?? 0) * p.in * 1.25 + // 5-minute cache writes
      (u.cache_read_input_tokens ?? 0) * p.cacheRead +
      u.output_tokens * p.out) / 1_000_000;
  return opts.batch ? usd / 2 : usd;
}

export function logCall(route: string, res: Anthropic.Message, timing: { ttftMs: number | null; totalMs: number }) {
  const u = res.usage;
  console.log(JSON.stringify({
    at: new Date().toISOString(), route, model: res.model, id: res.id, stop: res.stop_reason,
    input: u.input_tokens, cacheWrite: u.cache_creation_input_tokens ?? 0, cacheRead: u.cache_read_input_tokens ?? 0,
    output: u.output_tokens, ...timing, usd: Number(costUsd(res.model, u).toFixed(6)),
  }));
}
The route field is the important one. Cost per model tells you little. Cost per feature, and better, cost per completed task, tells you where to work. A cheap request that needs three retries to finish the job is not cheap.
Lever one: prompt caching, stable prefix first
Most product prompts are mostly the same on every request: the instructions, the tool definitions, a block of reference material. Prompt caching lets you pay full price for that prefix once and a small fraction of it after that, and it also cuts time to first token because the model skips reprocessing it.
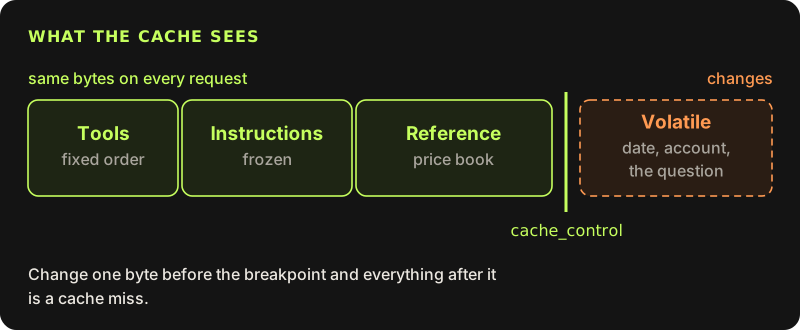
The rule that makes it work is that the cache matches a prefix byte for byte. The request is read in a fixed order: tools, then the system prompt, then messages. Anything that changes between requests has to come after the last cache breakpoint, or it breaks the cache for everything behind it.
const res = await client.messages.create({
  model: "claude-sonnet-5-5",
  max_tokens: 16000,
  tools: TOOLS, // same tools in the same order on every request
  system: [
    { type: "text", text: INSTRUCTIONS },
    { type: "text", text: PRICE_BOOK, cache_control: { type: "ephemeral" } },
  ],
  messages: [
    { role: "user", content: `Today is ${today}. Account: ${account.name}\n\n${question}` },
  ],
});
The mistakes that break caching are all small. A timestamp at the top of the system prompt. A tool list filtered per user, or built from an object whose key order is not fixed. A "you are talking to {name}" line in the instructions. Each of these makes every request a cache write instead of a read. The way to catch them is the cost log: cacheRead should be large and cacheWrite small on a warm route. If both stay flat at zero, check the prefix length too, because prefixes below a model-specific minimum are silently not cached.
Caching also needs traffic. The default cache entry lives for five minutes and is refreshed on every hit, so a route called every few seconds stays warm on its own. A route called twice an hour mostly misses. There is a longer one-hour option with a higher write price, which only pays off when requests sharing a prefix come in steadily with longer gaps between them.
Lever two: the right model per request
The easiest saving that does not touch quality is not using the largest model for work a smaller one does equally well. Classifying an inbound message, pulling three fields out of a form, or deciding which queue a ticket goes to rarely needs the top model.
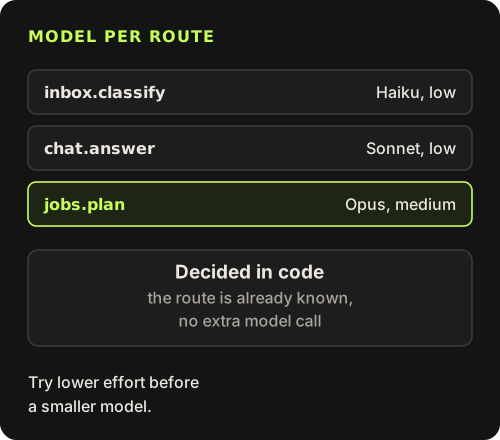
I choose the model by route, in code, not by asking another model to classify each request first. The product already knows whether a request came from the inbox sorter or from the planning assistant. Adding a model call to decide that adds latency and cost to every request, and makes the system harder to reason about.
type Effort = "low" | "medium" | "high";
export const ROUTES: Record<string, { model: string; effort: Effort }> = {
  "inbox.classify": { model: "claude-haiku-5-5", effort: "low" },
  "chat.answer": { model: "claude-sonnet-5-5", effort: "low" },
  "jobs.plan": { model: "claude-opus-5-5", effort: "medium" },
};
// later: output_config: { effort: ROUTES[route].effort }
Two cautions. Before dropping a route to a smaller model, try the same model at a lower effort setting; on current models that is often enough, and it keeps one cache instead of splitting traffic across models, since caches are per model. And every change here goes through the eval harness from the earlier post. A downgrade that drops the score is not a saving, it is a quality cut with a delayed bill.
Lever three: stream, and measure time to first token
For anything a person watches, total time matters less than the time until something appears. Streaming does not make the response finish sooner, but it changes how long the wait feels. When I built a small lab to compare text-to-speech voices, the number I ended up caring about most was time to first byte, not time to complete. The same holds for text.
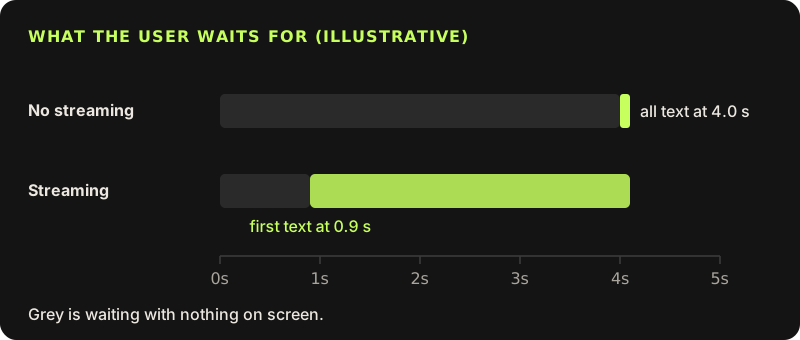
Measure time to the first text token, not to the first event. Current Claude models think before they answer, and by default the thinking is not shown, so the stream can open well before any visible text arrives. If that gap is long on a chat route, lower the effort, use a faster model for that route, or show a progress state.
const t0 = performance.now();
let ttftMs: number | null = null;

const stream = client.messages.stream({ model, max_tokens: 16000, system, messages, output_config: { effort: "low" } });
for await (const event of stream) {
  if (event.type === "content_block_delta" && event.delta.type === "text_delta") {
    ttftMs ??= performance.now() - t0;
    send(event.delta.text);
  }
}
const final = await stream.finalMessage();
logCall("chat.answer", final, { ttftMs, totalMs: performance.now() - t0 });
Lever four: batch what nobody is waiting for
A lot of LLM work in a product is not interactive: re-summarizing records overnight, tagging a backlog, running the full eval set. The batch API takes those requests, runs them asynchronously, and charges half price. Most batches finish within an hour; the limit is a day.
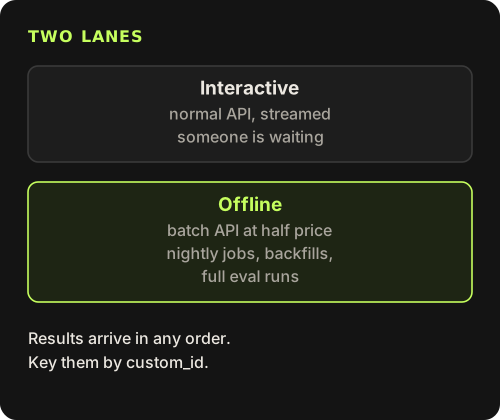
Results come back in any order, so every request carries a custom_id that maps back to your own record. Errors come back per request too, which means a batch job needs the same retry logic as anything else, just slower.
const batch = await client.messages.batches.create({
  requests: rows.map((row) => ({
    custom_id: row.id,
    params: { model: "claude-haiku-5-5", max_tokens: 4000, system: SUMMARY_PROMPT, messages: [{ role: "user", content: row.notes }] },
  })),
});
// later, once processing_status is "ended":
for await (const r of await client.messages.batches.results(batch.id)) {
  if (r.result.type === "succeeded") await saveSummary(r.custom_id, r.result.message);
  else await markForRetry(r.custom_id, r.result.type);
}
The order matters
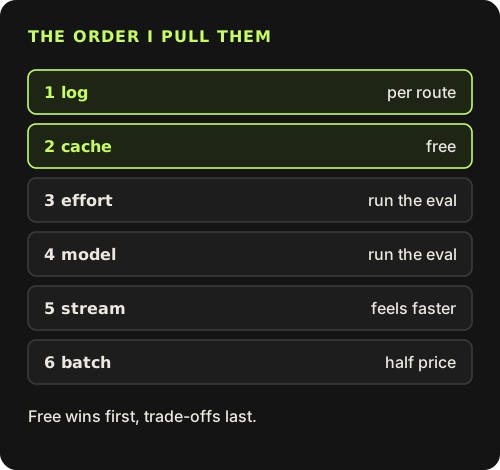
I pull them in this order because the early ones are free and the later ones cost something. Logging and caching change nothing about the output. Effort and model choice change quality, so they go through the eval set. Streaming changes perceived latency but not the bill. Batching changes when work happens, which is only free if nobody was waiting for it.
Log every call with its route
Four token counts, time to first token, total time and dollars, so you can find the expensive feature.
Make the prefix stable and cache it
Tools and instructions fixed, volatile data after the breakpoint, and cache reads checked in the logs.
Lower effort before changing models
Then pick the model per route in code, and run the eval before every change.
Stream interactive routes
Measure time to the first text token and fix it per route.
Batch the offline work
Half price for anything nobody is waiting on, keyed by custom_id.
None of these levers is clever on its own. What makes them work is the log line. Once every request says what it cost and where it came from, the next saving is usually obvious, and it is rarely the one someone guessed on the day the first bill arrived.